USK Consulting Africa

Preparing your premium proposal...

Premium Mining Consultation

SASOL MINING SECUNDA Coal Stockpile Assessment

Unlocking the potential of seven historical coal stockpiles through advanced assessment methodology and 3D/4D modeling for optimal synfuels production.

0
M Tons
Total Tonnage
0
%
Confidence Level
0
Points
Sample Points
ISO
Certified Standards
Project Overview

Transforming Coal Assessment

USK Consulting Africa presents a comprehensive solution to assess and unlock the value of SASOL's historical coal stockpiles through advanced sampling, analysis, and predictive modeling.

Strategic Assessment

Systematic evaluation of seven stockpiles using ISO-compliant sampling methodology for gasification suitability.

3D/4D Modeling

Advanced predictive models providing actionable insights for optimal resource utilization and operational efficiency.

Quality Assurance

95% confidence intervals with rigorous QA/QC protocols ensuring defensible and actionable results.

Stockpile Inventory

Complete Coal Stockpile Analysis

Comprehensive analysis of seven strategic stockpiles totaling 2.4 million tons with advanced visualization and interactive controls.

1
Side 1
Priority #1
Active
757,944
Tons
12.0m
Max Height
605×145
Dimensions (m)
128
Sample Points
Trapezoidal
Assessment Progress 32%
6
Side 6
Priority #3
Active
937,825
Tons
13.0m
Max Height
691×145
Dimensions (m)
160
Sample Points
Trapezoidal
Assessment Progress 40%
4
Side 4B
Priority #3
Pending
313,217
Tons
9.0m
Max Height
228×212
Dimensions (m)
56
Sample Points
Conical Frustrum
Assessment Progress 14%
3
Side 3
Priority #5
Pending
112,200
Tons
4.0m
Max Height
24
Sample Points
Trapezoidal
Assessment Progress 6%
5
Side 5
Priority #6
Pending
88,704
Tons
4.0m
Max Height
16
Sample Points
Trapezoidal
Assessment Progress 4%
2
Side 2
Priority #4
Pending
85,428
Tons
4.0m
Max Height
16
Sample Points
Trapezoidal
Assessment Progress 4%
4
Side 4
Priority #2
Pending
59,508
Tons
4.0m
Max Height
16
Sample Points
Trapezoidal
Assessment Progress 4%

Stockpile Analytics Dashboard

Summary Statistics
Total Volume 1,960,355 m³
Total Tonnage 2,354,826 tons
Average Density 1.20 t/m³
Stockpile Count 7 Sites
Max Height 13.0m (Side 6)
Total Footprint ~180 hectares
Assessment Timeline
Site Survey Completed

Initial assessment and mapping

Week 1-2
Sampling Phase 1

Side 1 & Side 4 assessment

Week 3-6
Sampling Phase 2

Side 6 & Side 4 assessment

Week 7-12
Final Assessment

Remaining stockpiles

Week 13-16
Stockpile Comparison
Stockpile Volume (tons) Priority Progress Status
Side 1 757,944 High 32% Active
Side 6 937,825 Medium 40% Active
Side 4 313,217 Medium 14% Pending
Side 4 59,508 High 4% Pending
Side 2 85,428 Medium 4% Pending
Side 3 112,200 Low 6% Pending
Side 5 88,704 Low 4% Pending

Site Location - Interactive Map

Real-time satellite view of stockpile locations

Lot 1 Coordinates

26°34'28.79"S 29°9'4.83"E

Lot 2 Coordinates

26°34'33.40"S 29°10'10.30"E

Sampling Strategy

Approach And Methodology

Advanced interactive dashboard with real-time sampling visualization, methodology breakdown, and quality control monitoring for 95% confidence intervals.

0
Total Sample Points
Strategically distributed across all stockpiles
85%
0
Total Increments
Three-layer depth stratification
72%
0
Total Lots
Maximum 50,000 tons per lot
95%
0
Confidence Level %
ISO 13909 compliant standards
95%
1
Side 1
Priority #1
Active
128 Samples
16 Lots
7.2m Avg Depth
384 Increments
Completion 32%
6
Side 6
Priority #3
Active
160 Samples
20 Lots
7.8m Avg Depth
480 Increments
Completion 40%
4
Side 4B
Priority #3
Pending
56 Samples
7 Lots
5.4m Avg Depth
168 Increments
Completion 14%
4
Side 4
Priority #2
Pending
16 Samples
2 Lots
2.5m Avg Depth
48 Increments
Completion 4%
Lot Size Design

Maximum 50,000 tons per lot ensures manageable sample volumes and statistical validity

Max Lot Size: 50,000 tons
Total Lots: 52 lots
Sampling Locations

8 drill points per lot, distributed in systematic grid with random start point (ASTM D6913)

Points per Lot: 8 points
Pattern: Systematic Grid
Depth Stratification

Three discrete increments (top/middle/base) to capture vertical segregation effects

Increments: 3 layers
Coverage: Full depth
Sample Mass

≥50 kg per increment exceeds ISO 13909 requirements for 125mm top size

Min Mass: 50 kg
Top Size: 125 mm

Core Sampling Technique

Method

Rubber Tracked Hydraulic Powered Drill equipped with Hollow-stem auger with continuous split-spoon sampling (152mm diameter)

Advantage

Exceeds maximum particle size (125mm), eliminating bias from particle exclusion

Procedure
  • Pre-drill purge (discard first 1m)
  • Continuous coring from top to base
  • Liner retention for 100% recovery
  • Incremental splitting (top/middle/base)
Duplicate Samples

10% duplicate (randomly selected) to quantify measurement precision

10% Duplication Rate
Bias Testing

5% of lots undergo surface-vs-core comparisons to detect sampling bias

5% Bias Testing
Variogram Analysis

Post-sampling spatial variability assessment to optimize future programs

95% Confidence

Expected Outcomes & 95% Confidence Intervals

Parameter Confidence Interval (±) Test Method Standard
Ash Content % ±1.8% (absolute) ISO 1171 / ASTM D3174 International
Sinks Content % ±2.2% (absolute) ISO 1953 (1.6 SG cut) International
Fines Content % ±3.0% (absolute) ISO 1953 (-0.5mm) International
Full PSD Grading ±5% per size fraction ISO 1953 (wet sieving) International

Standards Compliance & Defensibility

ISO 13909-4:2016

Mechanical Sampling from Stockpiles

SANS 181:2023

SA Coal Characterization Norms

ASTM D2234/D2013

Sample Collection/Preparation

ISO 3086:2020

Quality Standards

3D/4D Visualization

Advanced Coal Stockpile Modeling

Utilizing Earth Volumetric Studio (EVS) to generate dynamic 3D models and time-based (4D) insights into coal stockpiles.

EVS Coal Stockpile Model
  • Modeling & Visualization: Detailed 3D models of coal stockpiles for shape and structure analysis.
  • Volume Quantification: Accurate coal volume calculations for inventory management.
  • Data Integration: Seamlessly combines geostatistical, sampling, and remote sensing data.
  • 4D Tracking: Monitors changes in coal mass and geometry over time.

3D Stockpile Visualization

Interactive 3D Model

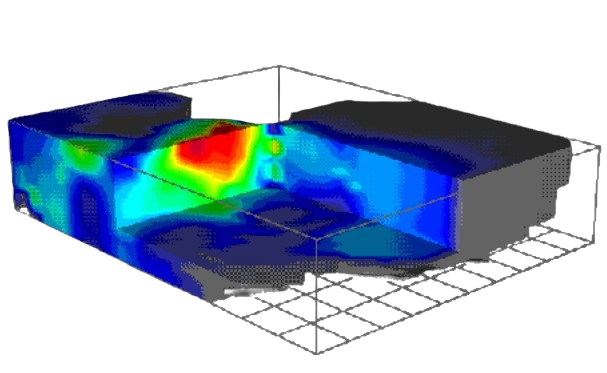
Advanced 3D visualization of stockpile sampling points and drill patterns

360° View
Layer Analysis
Sample Points
Quality Assurance

Quality Assurance & Control (QA/QC)

Validating precision and minimizing systematic errors through rigorous controls and international standards compliance.

Duplicate Samples

10% duplicate (randomly selected) to quantify measurement precision and ensure data reliability

10% Duplication Rate
Bias Testing

5% of lots undergo surface-vs-core comparisons to detect and eliminate sampling bias

5% Bias Testing
Variogram Analysis

Post-sampling spatial variability assessment to optimize future sampling programs

95% Confidence
Implementation Timeline

Project Implementation Schedule

Phased approach optimizing resource allocation and risk management across 16 weeks of comprehensive assessment.

1

Phase 1: Side 1 Assessment

Weeks 1-4
High Priority
757,944 Tons
128 Sample Points
16 Lots
Project Cost Allocation 34%
2

Phase 2: Side 4 Assessment

Weeks 5-6
Quick Completion
59,508 Tons
16 Sample Points
2 Lots
Project Cost Allocation 2%
3

Phase 3: Sides 6 & 4

Weeks 7-12
Major Volume
1.25M Tons
216 Sample Points
27 Lots
Project Cost Allocation 57%
4

Phase 4: Final Assessment

Weeks 13-16
Completion
286K Tons
56 Sample Points
7 Lots
Project Cost Allocation 7%

Detailed Project Schedule

Side 1 - Priority Stockpile
Total: 102 Days
Sampling (60 days)
Lab (14 days)
Processing (7 days)
Modelling (14 days)
Reporting (7 days)
Side 2
Total: 56 Days
Sampling (14 days)
Lab (14 days)
Processing (7 days)
Modelling (14 days)
Reporting (7 days)
Side 3
Total: 56 Days
Sampling (14 days)
Lab (14 days)
Processing (7 days)
Modelling (14 days)
Reporting (7 days)
Side 4
Total: 72 Days
Sampling (30 days)
Lab (14 days)
Processing (7 days)
Modelling (14 days)
Reporting (7 days)
Side 5
Total: 56 Days
Sampling (14 days)
Lab (14 days)
Processing (7 days)
Modelling (14 days)
Reporting (7 days)
Side 6 - Major Volume
Total: 139 Days
Sampling (90 days)
Lab (21 days)
Processing (7 days)
Modelling (14 days)
Reporting (7 days)

Interactive Gantt Chart

Week 1-4 Week 5-8 Week 9-12 Week 13-16
Phase 1: Side 1
Phase 2: Side 4
Phase 3: Sides 6 & 4
Phase 4: Final Assessment

Project Timeline Summary

16
Weeks Duration
ZAR 4.0M
Total Project Cost
416
Sample Points
95%
Confidence Level
Project Cost

Project Cost Overview

Comprehensive project cost breakdown with prioritized implementation and transparent cost structure.

Project Cost Breakdown

1
Side 1
Priority #1 • 128 Samples
R 1,150,220.00
Sampling: | Data Processing and Modelling: | Reporting:
34% of total project cost
6
Side 6
Priority #3 • 160 Samples
R 1,522,350.00
Sampling: | Data Processing and Modelling: | Reporting:
45% of total project cose
4
Side 4
Priority #3 • 56 Samples
R 489,080.00
Sampling: | Data Processing and Modelling: | Reporting:
12% of total project cost
2-5
Remaining Sides
Priorities #2,3,5 • 72 Samples
R 332,650.00
Sampling: | Data Processing and Modelling: | Reporting:
9% of total project cost

Project Cost Summary

HSSE Requirements R 40,000.00
Mobilisation & Demob R 50,000.00
Sampling & Reporting R 3,494,300.00
Laboratory Testing SASOL Internal
Accommodation R 140,000.00
Project Management (10%) R 372,430.00
Project Cost R 4,096,730.00
*Excluding laboratory costs (SASOL preferred rates)
Project Cost Benefits
95% confidence in coal quality data
Optimized gasification efficiency
Reduced operational risks
Enhanced resource utilization
Get In Touch

Ready to Begin Implementation?

Contact USK Consulting Africa to begin implementation of your comprehensive coal stockpile assessment solution.

Dr. Steve Kalule

Managing Director

USK Consulting Africa (Pty) Limited
Unit 1, 618 Sunset Dr, Muldersdrift, Krugersdorp, Gauteng, 1740 South Africa
USK Consulting Africa

Premium Mining Consultation

ISO Certified

Industry Standard Compliance

Proven Results

Data-Driven Solutions